High memory utlization of Oracle database
Memory nearly exhausted in one oracle database server.Almost 100GB is occupied.

As we know,oracle memory is made up of PGA and SGA,so I generate awr report to analyse it. as shown in the following.
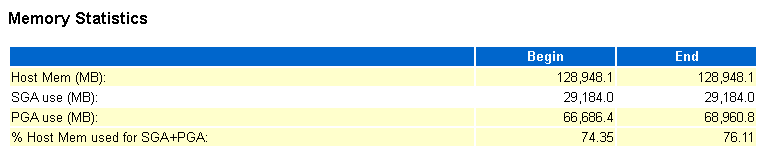
It’s obvious that the size of PGA is high reach to 66GB and size of SGA is 29GB,thus there is a big suspection on PGA.
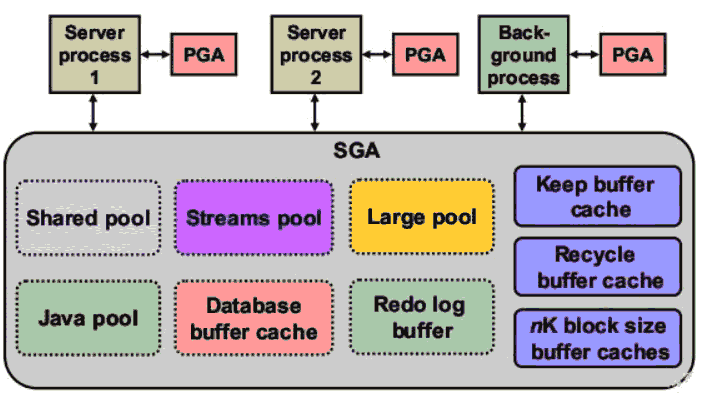
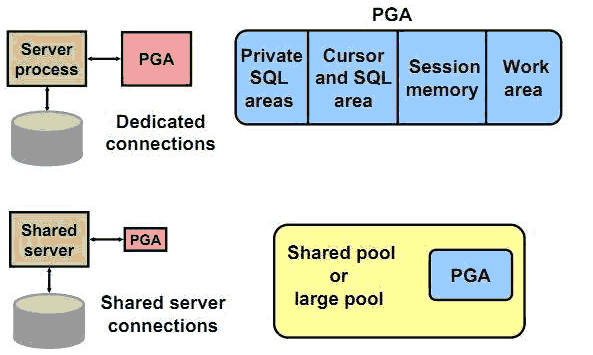
From the picture below,we can get information that PGA is related about server processes and background process, all user session will be kept in PGA.
So I executed the following SQL to check memory utlization of each process.
select PID,SPID,PGA_ALLOC_MEM/1024/1024 MB from v$process ORDER BY MB;
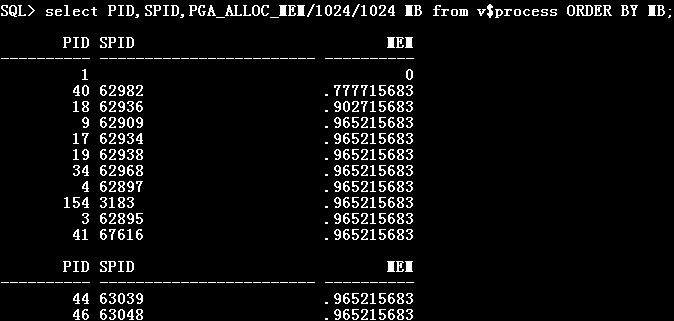
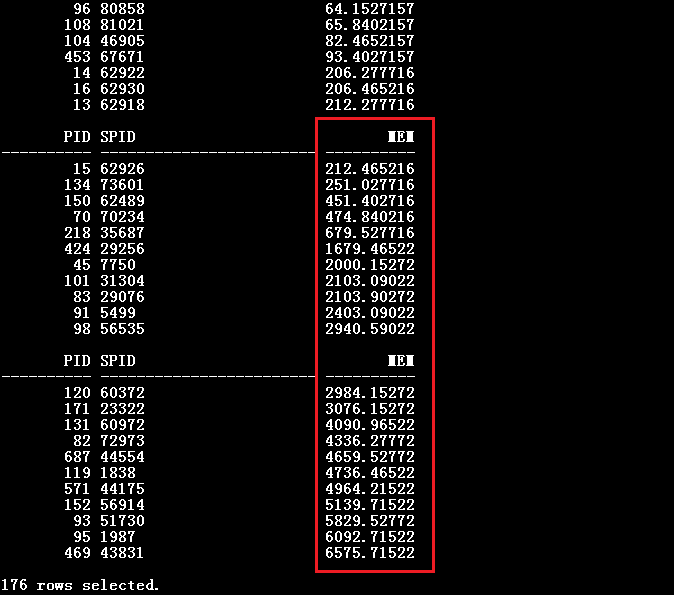
From the information above read box, huge size of PGA is occupied by each process. SPID means that operation system process number. and according process number we can get the information of which jdbc client connect database server by executing command “netstat -tanlp | grep SPID”, for example SPID is 44175, we’ll know wich ip and port of client connection database.

So. client ip is 192.168.17.6 and port is 47244. Login client and execute command “netstat -tanlp | grep 47244” to get pid number of client program.

From pid number 4842, we will know which program connect database server by ps command.
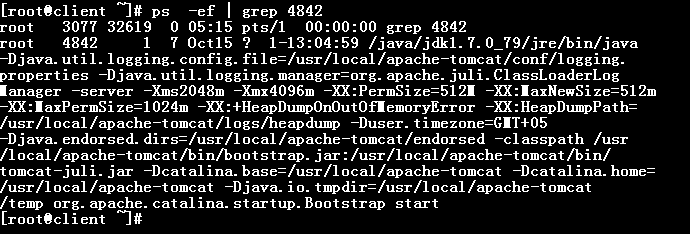
Now we can analyse logs(such as catalina.out) of this program, or we can also analyse SQL sentences and sessions by PID.
However if it’s an emergency, the fastest way is to restart client program(the abow tomcat ). and memory utlization of database server will be reduced. But if you need to solve the problem completely, try to analyse program logs, SQL sentences or awr of database,and fix bug, optimizing program and database.